
B2B Growth Marketing Metrics: A Deep Dive into What Truly Drives Scale


Let’s face it: in the B2B world, "gut feeling" isn't a growth strategy. You can run dazzling campaigns, pour resources into lead generation, and build an incredible product, but if you don't know what to measure, you're essentially driving blind. This isn't about vanity metrics – the likes, shares, or even raw website traffic that can look good on a slide but tell you nothing about your bottom line. This is about real, hard data that tells you if your B2B growth marketing efforts are actually moving the needle, driving revenue, and building sustainable scale.
For too long, B2B marketing has been shrouded in ambiguity when it comes to return on investment (ROI). Sales teams have their quotas, but how does marketing truly contribute to that final dollar? The answer lies in mastering your metrics. We're talking about key performance indicators (KPIs) that aren't just numbers on a dashboard, but actionable insights that pinpoint what’s working, what’s not, and where you need to double down your efforts.
Consider this: a recent report indicated that top-performing B2B companies can push conversion rates above 5%, significantly outperforming the industry average of around 2.9%. How do they do it? By meticulously tracking and optimizing the right metrics. They don't just do marketing; they measure it, learn from it, and refine it.
This guide is your roadmap. We’re going to strip away the fluff and dive deep into the B2B growth marketing metrics that truly matter. We'll explore everything from the top of the funnel to customer retention, show you how to measure ROI, understand attribution, and even how cutting-edge tools like AI are transforming the game. By the time you're done, you'll have a clear, actionable blueprint for using data to fuel your B2B growth.
The Foundation: Understanding the B2B Marketing Funnel and Core Metrics
Before we dissect individual metrics, it's crucial to ground ourselves in the B2B marketing funnel. Unlike B2C, the B2B buyer journey is often longer, involves multiple stakeholders, and requires a different set of touchpoints. Your metrics need to reflect this complexity. We'll break down the funnel into key stages and identify the essential KPIs for each.
A. The Traditional B2B Marketing Funnel: A Quick Recap
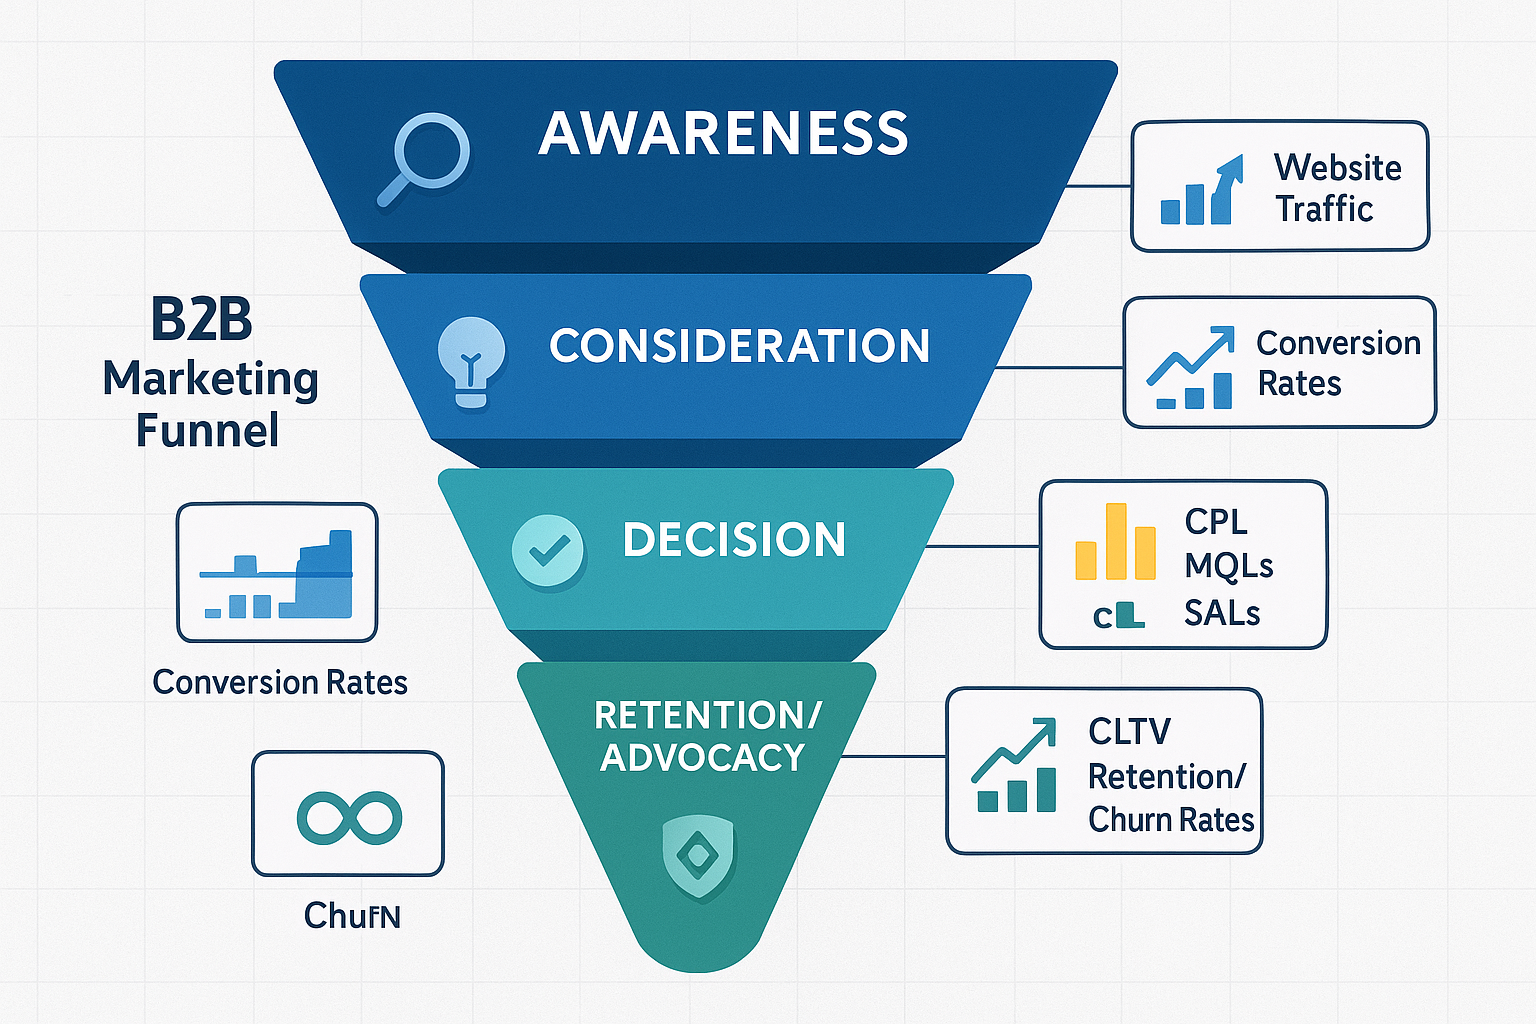
Let’s quickly define the stages. You've got:
- Awareness: This is where potential customers first realize they have a problem, and they start looking for solutions. Your job here is to make sure your solution is on their radar.
- Consideration: Once aware, prospects dive deeper, evaluating different options, including yours. They’re looking for evidence, case studies, and detailed information.
- Decision: This is crunch time. Prospects choose a solution and become customers. This stage often involves sales conversations, negotiations, and contract signing.
- Retention/Advocacy: The journey doesn't end at the sale. Happy customers stay, grow their relationship with you, and even become advocates, referring new business.
B. Why Traditional Metrics Fall Short in Modern B2B Growth
If you're still relying solely on old-school metrics, you're missing out on the full picture. Here’s why:
- Siloed Data: Imagine your marketing team tracking website visits, sales tracking deals closed, and customer success tracking support tickets, all in separate systems. The result? A fragmented view where no one truly understands the end-to-end customer journey or how each department impacts the next. You can't optimize what you can't see holistically.
- Focus on Volume Over Quality: How many times have you heard "We generated 10,000 MQLs last month!"? Sounds great, right? But if those Marketing Qualified Leads (MQLs) don't convert into paying customers, they're just noise. Focusing solely on MQL volume without understanding their quality or conversion potential is a classic trap that wastes resources.
- Lack of Long-Term View: Many businesses stop measuring once the deal is closed. But for B2B, especially in SaaS, the real money is in retention and expansion. Ignoring metrics beyond initial conversion means you're missing the bigger picture of customer lifetime value (CLTV) and risking high churn rates. It’s like filling a leaky bucket – you’ll never get ahead.
C. Core Metrics Across the Funnel: What Every B2B Marketer Needs to Track
Now, let's talk about the metrics that genuinely matter for B2B growth marketing. These are your foundational KPIs.
- Website Traffic (by Source): It's not just about how many visitors you get; it's about where they come from.
- Organic Traffic: This is your bread and butter. Visitors coming directly from search engines indicate strong SEO and content relevance. The higher your organic traffic from relevant keywords, the better your long-term, low-cost lead generation. If you want to boost this, start by understanding how to perform proper keyword research.
- Referral Traffic: These are visitors from other websites, often partners, directories, or industry publications. This signifies valuable backlinks and relationship building.
- Paid Traffic: Visitors from your paid advertising efforts (Google Ads, LinkedIn Ads, etc.). This is where you need to be ruthless about efficiency and ROI.
- Pro Tip: Don't just look at overall traffic. Segmenting traffic by source helps you understand which of your B2B lead generation channels are delivering the right kind of visitors – those who actually convert.
- Website Conversion Rate: This is the percentage of website visitors who complete a desired action. This could be anything from downloading an eBook to signing up for a demo.
- Specifics: Track Landing Page Conversion Rate for individual campaigns and Demo Request Conversion Rate for your primary sales funnel. For B2B SaaS, an average website visitor to lead conversion rate can vary by industry, but typical benchmarks hover around 1.5% to 2.5%. High-performing companies can often achieve 5% or more.
- Cost Per Lead (CPL): Simple but vital. It's your total cost of generating leads divided by the number of leads generated. If you spent $1,000 on a campaign and got 100 leads, your CPL is $10. This metric is crucial for assessing the efficiency of your lead generation campaigns and is a key component when calculating your overall B2B marketing ROI.
- Marketing Qualified Leads (MQLs): These are leads that show more than just casual interest. They've engaged with your marketing content in a significant way – maybe downloaded multiple whitepapers, attended a webinar, or visited your pricing page several times. They meet criteria that marketing has deemed indicative of sales readiness.
- Sales Accepted Leads (SALs): This is a critical handoff metric. An SAL is an MQL that the sales team has reviewed and accepted as genuinely worthy of follow-up. This metric highlights the quality of marketing's leads and the alignment between sales and marketing. A low MQL-to-SAL conversion rate points to a disconnect in lead definitions.
- Sales Qualified Leads (SQLs): These are SALs that the sales team has further qualified, meaning they have a clear need, budget, authority, and timeline (BANT criteria often apply here). They are ready for a deep sales conversation.
- Customer Acquisition Cost (CAC): This is the grand total of all your marketing and sales expenses divided by the number of new customers acquired over a specific period. For B2B SaaS, average CAC can range significantly, but a good rule of thumb is to aim for a CAC significantly lower than your CLTV. (We'll dive into CLTV next). For B2B companies, the average CAC can be around $536, but this varies wildly by industry and sales cycle complexity.
- Customer Lifetime Value (CLTV): Arguably the most important metric for long-term B2B success. It's the predicted total revenue that a customer will generate throughout their entire relationship with your business. This isn't just about the first sale; it includes all future purchases, upsells, and renewals. A healthy CLTV-to-CAC ratio (often aimed at 3:1 or higher) indicates a sustainable and profitable business model.
- Retention Rate & Churn Rate: These are two sides of the same coin.
- Retention Rate: The percentage of customers you keep over a specific period.
- Churn Rate: The percentage of customers who leave or cancel their service. In B2B, even a small increase in churn can have a massive impact on your bottom line and severely hinder your ability to craft a truly long-term B2B growth strategy. High retention is a hallmark of truly scalable growth.
Deep Dive: Acquisition & Lead Generation Metrics
This is the top of your funnel, where potential customers first interact with your brand. Getting this right means filling your pipeline with qualified prospects, not just noise. It’s about more than just eyeballs; it's about attracting the right eyeballs.
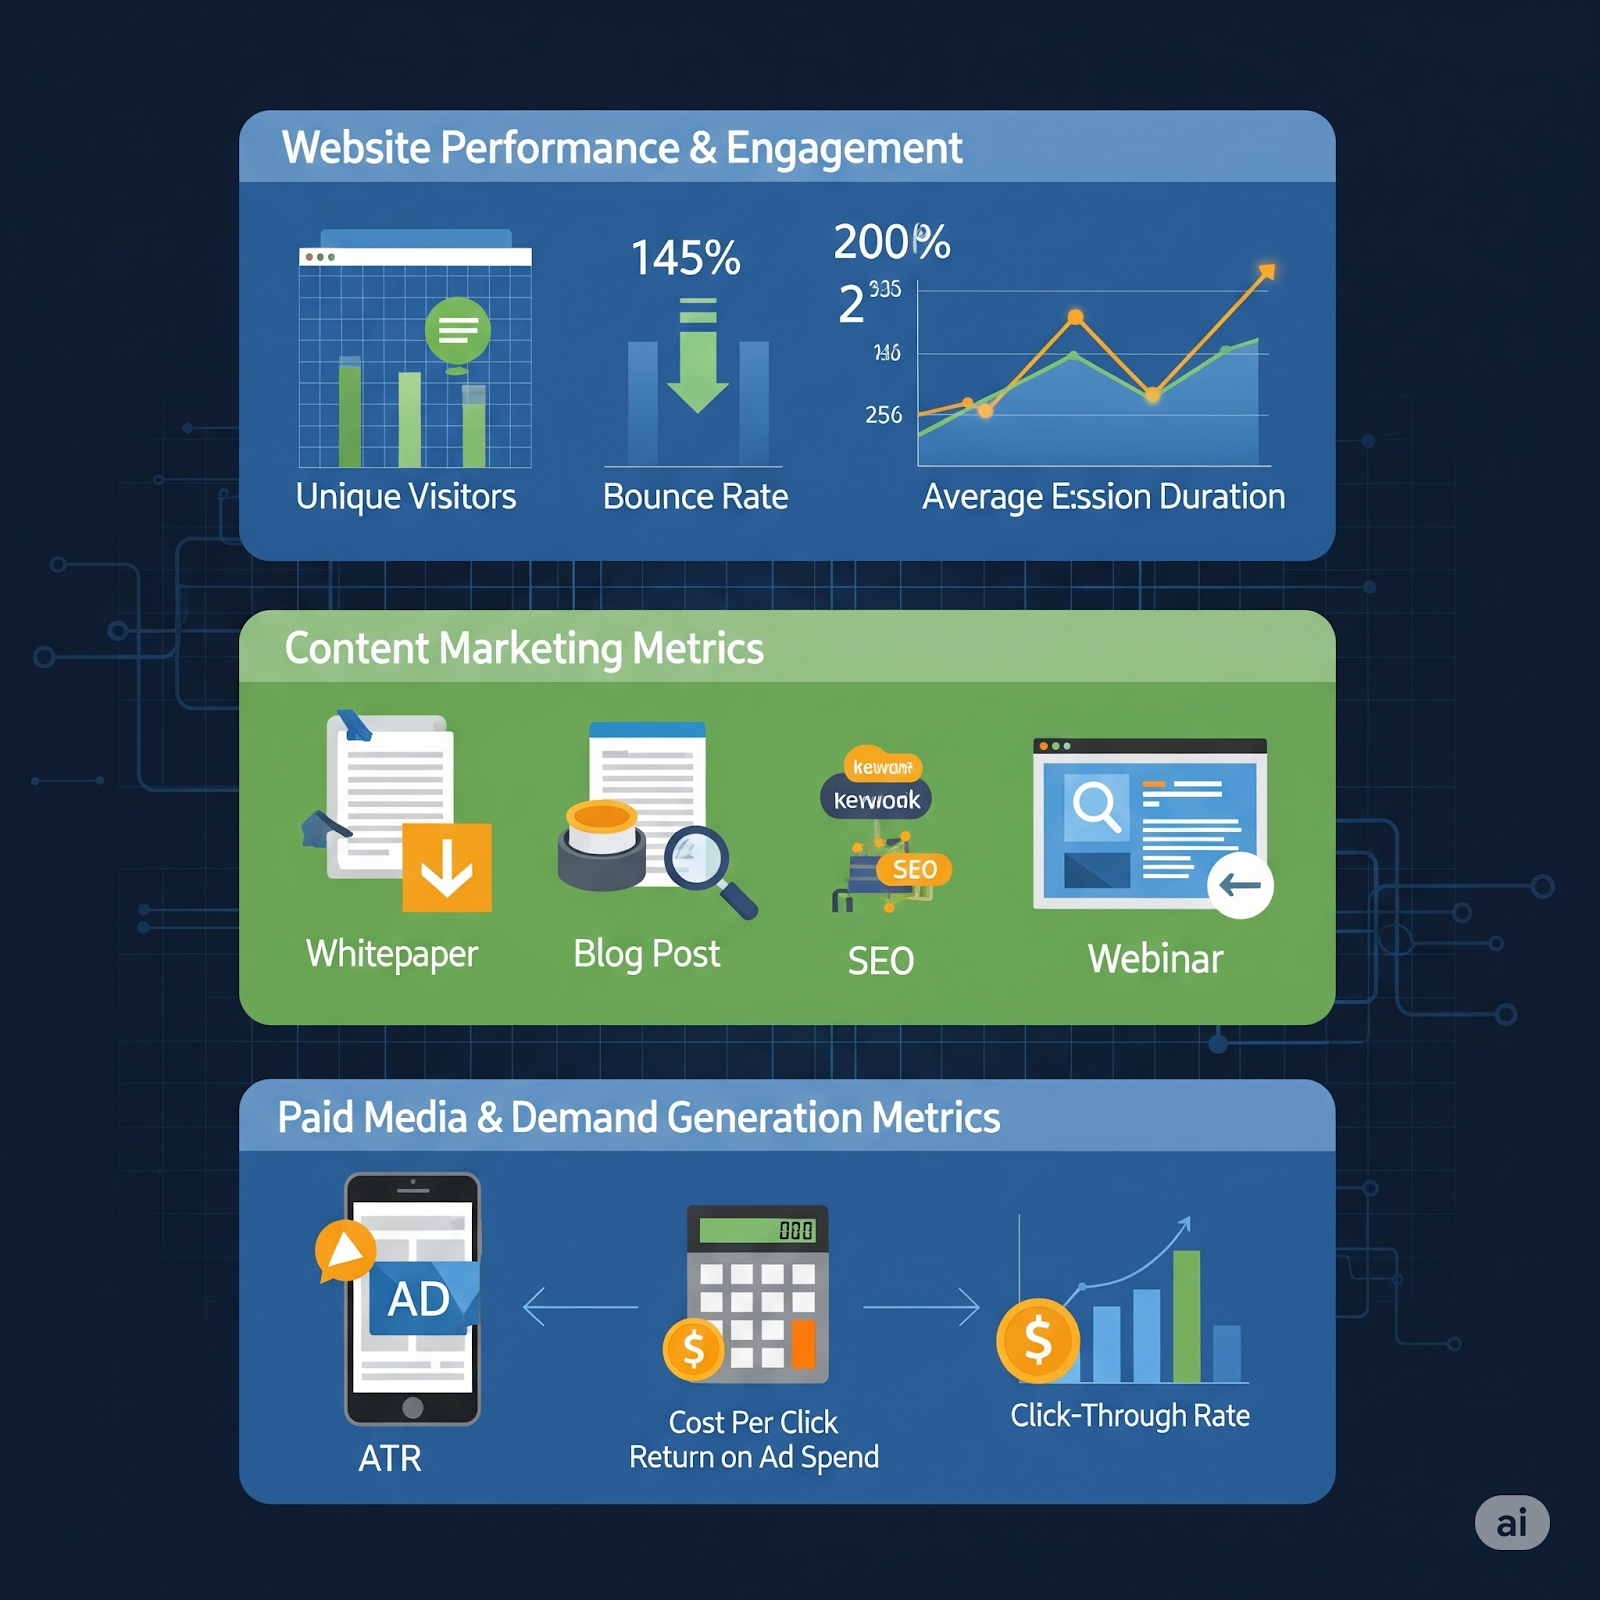
A. Website Performance and Engagement
Your website is often the first handshake a potential B2B customer has with your brand. Its performance metrics are non-negotiable for effective growth marketing.
- Unique Visitors: This tells you the number of distinct individuals visiting your site over a given period. It's a foundational metric for understanding your overall reach. While total visits can inflate due to repeat visitors, unique visitors give you a clearer picture of your audience size.
- Bounce Rate: This is the percentage of visitors who land on your site and leave without interacting further (e.g., clicking on another page, filling a form). A high bounce rate often indicates several issues: poor content relevance, slow page load times, confusing navigation, or simply that the visitor wasn't who you thought they were. For B2B content, aiming for a bounce rate under 50% is generally a good sign, though it varies by page type.
- Pro Tip: Look at bounce rate by page and by source. A high bounce rate from a specific paid campaign might mean your ad copy isn't matching the landing page content. A high bounce rate on a blog post might mean the content isn't fulfilling the search intent.
- Average Session Duration: How long users spend actively engaging with your website. Longer durations typically correlate with higher interest and engagement, especially on informative blog posts or detailed solution pages. For B2B, anything over 2-3 minutes can be a good sign, depending on your content.
- Pages Per Session: This metric tells you the average number of pages a user views during a single visit. A higher number suggests users are exploring your site deeply, finding related content, and potentially moving further down the funnel.
- Top Converting Pages: Don't treat all your website pages equally. Identify which specific pages are most effective at turning visitors into leads (e.g., demo requests, content downloads, contact form submissions). These are your goldmines. Once identified, analyze why they convert so well and apply those learnings to other pages.
B. Content Marketing Metrics for B2B Lead Generation
Content isn't just for brand awareness; it's a powerful B2B lead generation engine. But only if you measure its impact.
- Content Downloads/Gated Asset Conversions: How many prospects are downloading your whitepapers, eBooks, case studies, or detailed guides? These "gated" assets are powerful indicators of strong interest, as users are willing to exchange their contact information for the valuable content. Track the conversion rate for each asset.
- Blog Post Traffic & Engagement: Go beyond just page views. Which blog posts are attracting the most organic traffic (which is typically high-intent traffic)? More importantly, which ones keep readers engaged (look at metrics like time on page, scroll depth, and subsequent page views)?
- Pro Tip: If a blog post gets a lot of traffic but low engagement or high bounce rate, revisit the content and its SEO. Does it truly answer the user's query? Is it formatted for readability? Our guide on how to create compelling B2B marketing content that resonates can help you craft content that keeps readers hooked.
- Lead Magnet Conversion Rate: This is the percentage of visitors who complete the specific action required for a lead magnet. Whether it's a webinar sign-up, a free template download, or a checklist, a strong conversion rate here means your offer is compelling and your landing page is effective.
- SEO Performance: For B2B, strong SEO performance is non-negotiable for organic lead generation.
- Keyword Rankings: Where do you rank for your target B2B keywords? Monitor your positions for high-intent terms. Top rankings mean more organic visibility and clicks.
- Organic Search Visibility: This is your overall presence in search results. Are you appearing for a wide range of relevant queries, not just a few specific ones?
- Organic Click-Through Rate (CTR): How many people click your search result when it appears in search engine results pages (SERPs)? A low CTR for a high-ranking keyword might mean your meta title and description aren't compelling enough.
C. Paid Media & Demand Generation Metrics
Paid channels can deliver fast results, but only if you track their performance diligently to ensure a positive ROI.
- Impressions & Reach:
- Impressions: The total number of times your ads were displayed.
- Reach: The unique number of people who saw your ads. These are good for awareness, but don't tell the full story.
- Click-Through Rate (CTR): The percentage of people who clicked on your ad after seeing it. A higher CTR indicates your ad copy and visuals are relevant and compelling to your target audience. For LinkedIn Ads, for instance, a good CTR might be 0.5% - 1.5% for B2B, though it varies widely by industry.
- Cost Per Click (CPC): The average cost you pay for each click on your ad. This helps you manage your ad budget efficiently. Lower CPC means more clicks for your buck.
- Cost Per Acquisition (CPA) / Cost Per Lead (CPL) by Channel: This is crucial. Don't just look at overall CPL; break it down by each paid channel (Google Ads, LinkedIn Ads, etc.). You might find that while Google Ads generates more leads, LinkedIn leads convert at a much higher rate, making their higher CPL worthwhile. This data is essential for optimizing your paid B2B lead generation spend.
- Return on Ad Spend (ROAS): This metric tells you the revenue generated for every dollar spent on advertising. For example, if you spend $1,000 on ads and it generates $3,000 in revenue, your ROAS is 3:1. This is a direct measure of your ad campaign profitability.
Deep Dive: Engagement, Pipeline & Sales Metrics
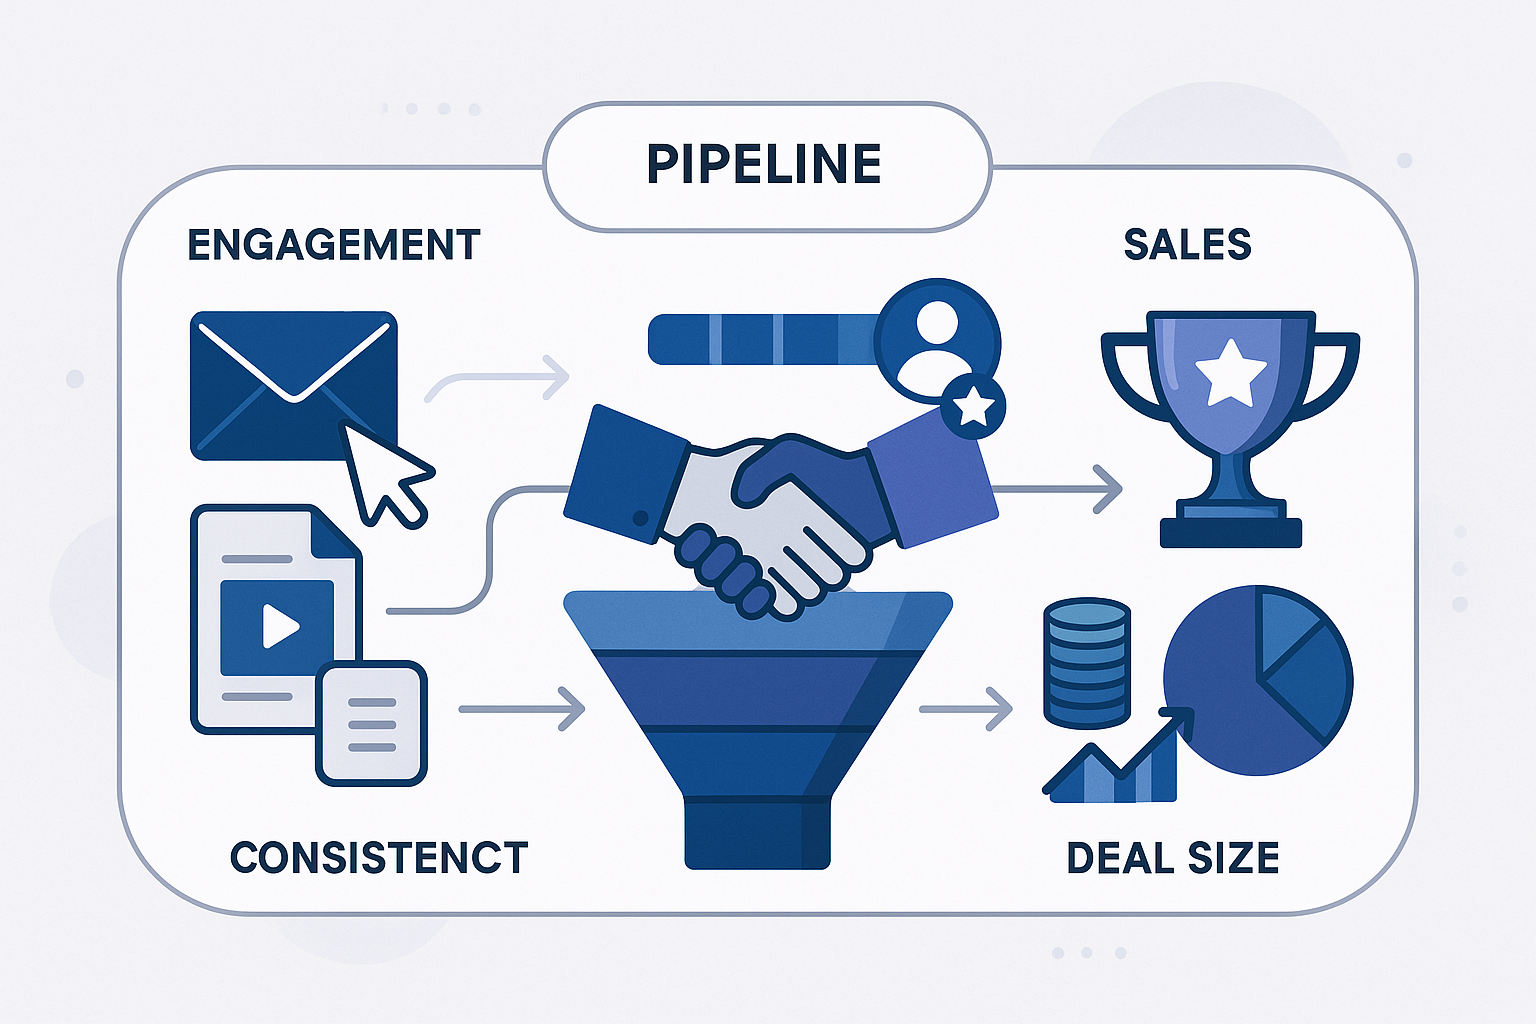
Once leads are acquired, the journey through the pipeline begins. These metrics show how effectively marketing moves prospects towards a sale and aligns with sales efforts. This is where the rubber meets the road, and the collaboration between marketing and sales becomes paramount.
A. Lead Nurturing & Engagement Metrics
You've captured leads; now you need to nurture them. These metrics reveal if your content and communication are doing their job.
- Email Open Rates & Click-Through Rates (CTRs): These are fundamental for assessing your email marketing effectiveness. A high open rate means your subject lines are compelling, and a high CTR means your email content is relevant and encourages action. For B2B, average open rates often hover around 20-25%, with CTRs typically in the 2-5% range, but context is everything.
- Pro Tip: Segment your email lists. You'll likely see much higher engagement from highly targeted segments (e.g., leads interested in a specific product feature) compared to a generic newsletter list. For more on this, check out our insights on email marketing for B2B best practices and strategies.
- Email Conversion Rate: This goes beyond clicks. It's the percentage of email recipients who complete a desired action after clicking through – perhaps registering for a webinar, visiting a product page, or initiating a demo request. This directly links your email efforts to pipeline progression.
- Marketing Automation Funnel Progression: If you're using marketing automation, track how many leads are successfully moving from one stage to the next in your automated nurture sequences. Are leads getting stuck at a particular point? Identify these bottlenecks to optimize your workflows. For example, if leads aren't moving from the "awareness" sequence to the "consideration" sequence, your content might not be compelling enough to drive deeper engagement.
- Content Engagement (Deeper Dive): Beyond just blog traffic, are leads engaging with high-value, middle-to-bottom-of-funnel content? Look at metrics for:
- Whitepaper/Case Study Views: Are leads consuming detailed content that addresses their specific pain points and positions your solution effectively?
- Product Demo Views/Completions: For video demos, track completion rates. Are prospects truly understanding your solution's capabilities?
- Time Spent on Solution Pages: Longer time spent on pages detailing your services indicates serious consideration.
B. Pipeline & Sales Handoff Metrics
This is the handshake between marketing and sales. Clear definitions and robust tracking here are crucial for a smooth and efficient sales process.
- MQL to SQL Conversion Rate: This metric is a direct reflection of the quality of your Marketing Qualified Leads and the effectiveness of your lead qualification process. If marketing sends 100 MQLs and sales only accepts 20 as SQLs, your conversion rate is 20%. A low rate signals a disconnect in lead definitions or poor lead quality from marketing's side. This is where tight alignment is paramount.
- SQL to Opportunity Conversion Rate: How many sales-qualified leads turn into active sales opportunities? This indicates the strength of your sales team's initial engagement and the true readiness of the leads.
- Pipeline Velocity: How quickly leads move through your sales funnel. A faster velocity often means a more efficient process and shorter sales cycles, directly impacting revenue. You can calculate this by dividing the number of opportunities by the average sales cycle length.
- Average Sales Cycle Length: The typical time it takes to close a deal from the first interaction to a closed-won deal. Marketing can influence this by providing better-qualified leads and relevant content throughout the journey. A shorter sales cycle generally means lower CAC and faster revenue recognition.
- Sales Qualified Lead (SQL) Volume: This is the total number of high-quality leads marketing is delivering to sales. While MQLs matter, SQLs are the ones that really count for sales. Your marketing efforts should ultimately be geared towards increasing this volume with high-quality leads.
- Product Qualified Leads (PQLs): For businesses with a product-led growth (PLG) component, PQLs are game-changers. These are users who have shown strong product engagement and fit, indicating sales readiness from their interaction with your product. For instance, a user might complete a critical setup step, invite multiple team members, or reach a usage limit on a freemium plan.
- Key Metric: PQL to Opportunity Conversion Rate: Companies leveraging PLG often see significantly higher conversion rates for PQLs compared to traditional MQLs. Some reports suggest PQLs convert 3x higher than MQLs because the user has already experienced value from the product.
- To truly understand how your product can drive this kind of lead generation, take a deep dive into The Ultimate Guide to B2B Product-Led Growth.
C. Sales Performance & Conversion Metrics (Marketing's Influence)
Even though these are sales metrics, marketing's contribution is undeniable.
- Opportunity to Win Rate: The percentage of sales opportunities that result in a closed-won deal. Marketing contributes by providing quality leads that are a good fit for the product and by creating compelling content that supports the sales process.
- Average Deal Size: The average revenue per closed deal. Marketing can influence this by attracting higher-value prospects and by highlighting the advanced features or enterprise solutions that lead to larger contracts.
- Revenue Generated (by Marketing Channel): This is where attribution becomes critical. How much final revenue can be directly attributed to specific marketing campaigns, content pieces, or channels? This shows marketing's direct impact on the bottom line. Without proper attribution, you’re just guessing which marketing activities are truly making money.
- Marketing-Originated Revenue: The percentage of total revenue that originated directly from marketing efforts (e.g., a lead generated by marketing that wasn't previously in the CRM).
- Marketing-Influenced Revenue: The percentage of total revenue where marketing had any touchpoint along the customer journey, even if sales initiated the deal. This is often a larger percentage and highlights marketing’s widespread impact.
Deep Dive: Customer Value & Retention Metrics
The sale isn't the end; it's the beginning. True B2B growth comes from retaining and expanding your existing customer base. These metrics illuminate the long-term value your marketing efforts are creating. After all, acquiring a new customer can cost five times more than retaining an existing one. That’s a stat that should make any B2B marketer sit up and pay attention!
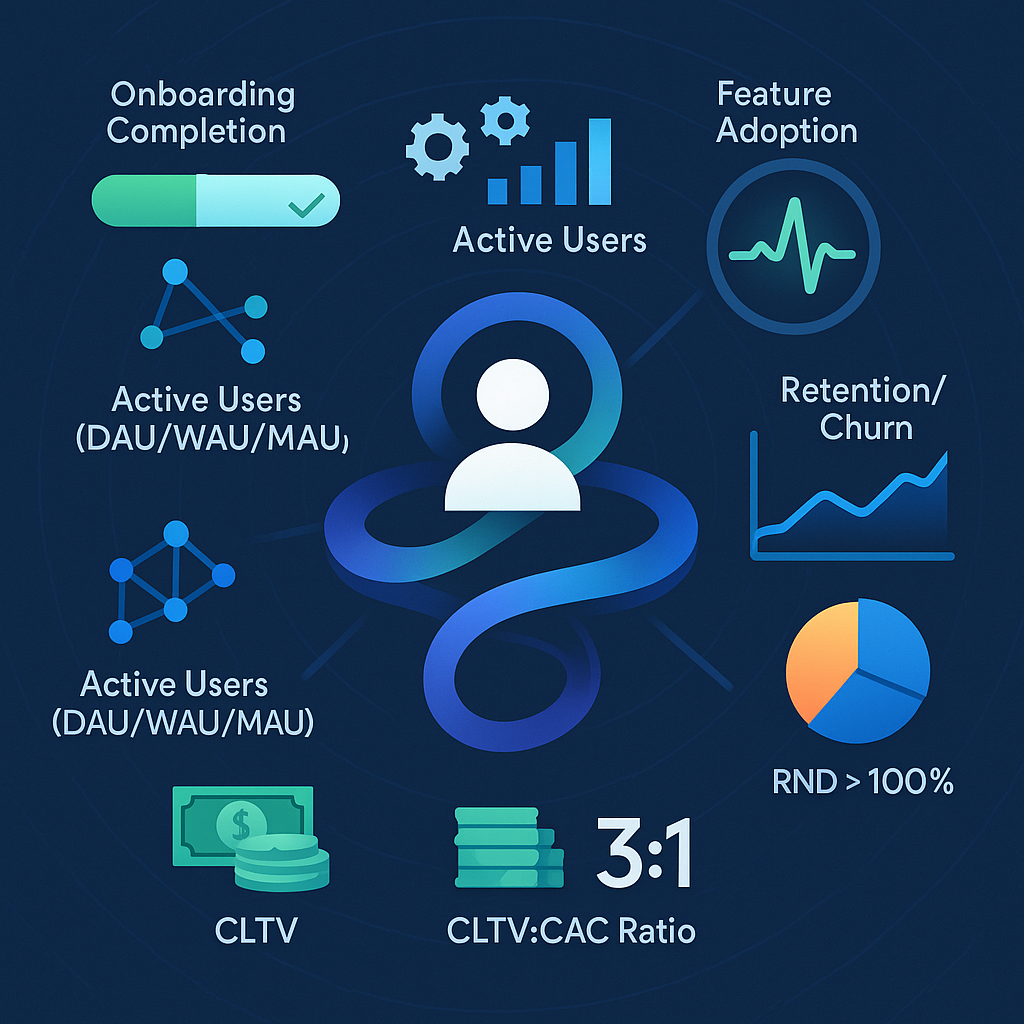
A. Post-Acquisition Engagement
Once you've sealed the deal, your focus shifts to ensuring your customers are not just active, but engaged and realizing continuous value from your solution.
- Onboarding Completion Rate: How many new customers successfully complete your onboarding process? This is incredibly important for early retention. If a customer struggles with setup or initial configuration, they're far more likely to churn before they even experience your product's core value. Track the percentage of users who complete key onboarding milestones (e.g., integrating with their existing tools, inviting team members, performing their first key action).
- Feature Adoption Rate: Which key features are your customers actually using? Are they leveraging the full value of your solution, or are they only scratching the surface? If critical features aren't being adopted, it could signal an issue with usability, awareness, or perceived value. This metric helps your product and marketing teams identify opportunities for better in-app guidance, tutorials, or targeted communication.
- Daily/Weekly/Monthly Active Users (DAU/WAU/MAU): For SaaS and subscription models, these metrics tell you how consistently users are returning to and interacting with your product.
- DAU: Daily Active Users
- WAU: Weekly Active Users
- MAU: Monthly Active Users A high ratio of DAU to MAU, for example, indicates a highly sticky and frequently used product. These are crucial indicators of sustained product engagement.
- Customer Health Score: This isn't a single metric but a composite one that combines various data points to give you an overall picture of a customer's health. It typically includes usage frequency, feature adoption, support interactions (are they submitting many tickets, or none at all?), survey feedback (NPS, CSAT), and even billing status. A low health score can be an early warning sign of churn, while a high score might indicate an upsell opportunity.
- Pro Tip: Automate the calculation and alerting of your customer health score. When a customer's score dips, trigger an alert for your customer success or sales team to proactively reach out. This is a prime area where AI enablement can transform reactive support into proactive retention, as we often implement for our clients at Growthmak.
B. Retention & Churn Metrics
These are the metrics that tell you how good you are at keeping customers and preventing revenue leakage. For B2B, minimizing churn is paramount, as the cost of losing a paying client can be substantial.
- Customer Retention Rate: The percentage of customers who remain customers over a specific period (e.g., month, quarter, year). If you start with 100 customers and end with 90, your retention rate is 90%. A strong retention rate is the backbone of sustainable B2B growth.
- Customer Churn Rate: The opposite of retention – the percentage of customers who cancel or do not renew their subscriptions. Even a 1-2% increase in monthly churn can devastate your annual recurring revenue (ARR). For B2B SaaS, a good monthly churn rate is often considered to be below 5%, with top performers aiming for 1-2%.
- Pro Tip: Understand the why behind churn. Conduct exit surveys, interview former customers, and analyze usage patterns leading up to cancellation. Is it product fit? Pricing? Customer service? This qualitative data is just as important as the numbers.
- Revenue Churn Rate (Gross vs. Net): This moves beyond just customer count to focus on the actual money.
- Gross Revenue Churn: This measures the total revenue lost from existing customers due to downgrades or cancellations. It doesn't account for any expansion revenue.
- Net Revenue Retention (NDR) / Net Dollar Retention: This is arguably the most important metric for B2B SaaS businesses. It measures the revenue from existing customers, including upsells, cross-sells, and increased usage, minus any revenue lost from churn or downgrades. An NDR above 100% means your existing customers are growing faster than any churn or downgrades, indicating true product stickiness and value. This means your current customers are generating more revenue this period than they did last, even if some have left. This is the holy grail for SaaS, indicating a strong, healthy business model. A good benchmark for NDR in B2B SaaS is often 110-120% or even higher for market leaders.
- Example: If you start with $100K in MRR from existing customers, lose $10K from churn/downgrades, but gain $20K from upsells/expansions, your NDR is 110% ($100K - $10K + $20K = $110K / $100K = 1.1).
C. Customer Lifetime Value (CLTV) & Profitability
These metrics are all about the long game. They tie everything together to show the true value of your customer relationships.
- Customer Lifetime Value (CLTV): Revisited. This is the predicted total revenue that a customer will generate throughout their entire relationship with your business. It's the North Star for long-term B2B profitability because it helps you understand how much you can afford to spend to acquire a customer while remaining profitable.
- Calculation Tip: A common simplified CLTV formula is: (Average Revenue Per Account (ARPA) x Average Customer Lifespan) - Customer Acquisition Cost. However, more sophisticated models often use: ARPA / Customer Churn Rate (for subscription businesses).
- External Link: For a comprehensive guide on CLTV calculation and its nuances, check out this detailed resource on How to Calculate Customer Lifetime Value.
- CLTV:CAC Ratio: This crucial ratio tells you how much revenue you expect to gain from a customer compared to how much it costs to acquire them. A healthy ratio (e.g., 3:1 or higher) indicates a sustainable business model where you're making significantly more from a customer than you spent to get them. If your ratio is below 1:1, you’re losing money on every customer you acquire.
- Expansion Revenue: This is revenue generated from your existing customers through upsells (selling a higher tier or more advanced version), cross-sells (selling additional products or services), and increased usage. This is often the most profitable growth engine in B2B because you've already acquired the customer, so the CAC for this additional revenue is minimal. Focus on providing continuous value so customers want to expand their relationship with you.
The Power of Attribution: Connecting Marketing to Revenue
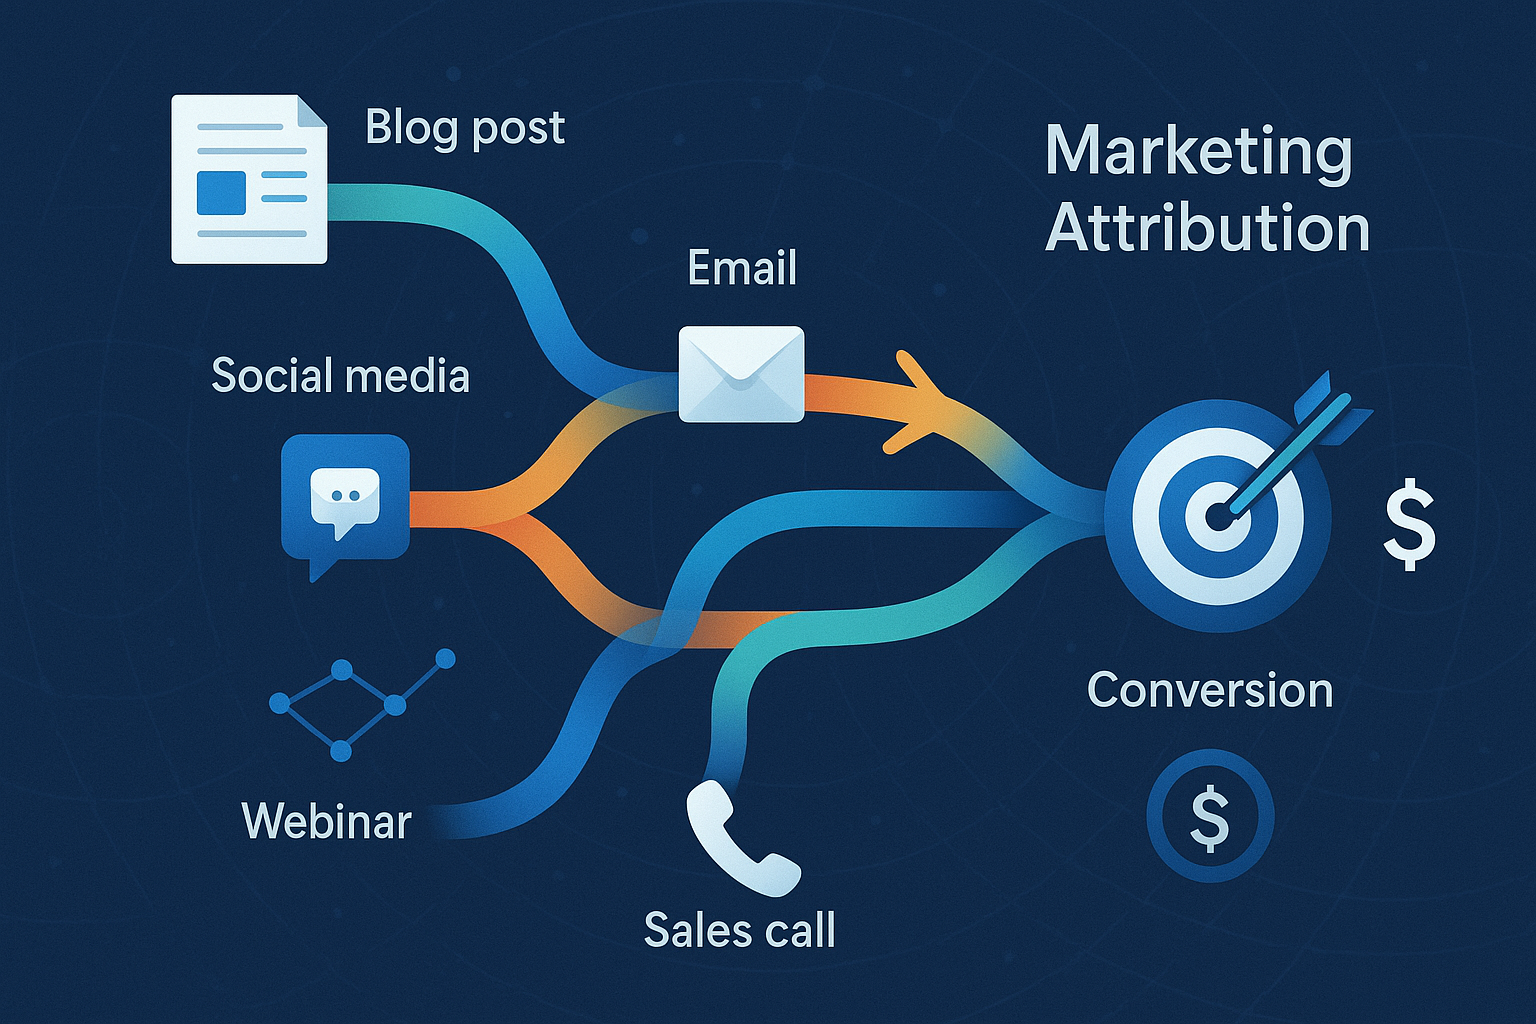
You're tracking metrics, but how do you know which marketing efforts deserve credit for the sale? This is the complex world of attribution, and for B2B, it's far from simple. It’s about more than just the last click; it’s about understanding the entire journey.
A. Why B2B Attribution is Complex
If you think B2C attribution is tricky, B2B adds several layers of complexity:
- Long Sales Cycles: Deals can take months, even years, with numerous marketing and sales touchpoints spread out over time. A prospect might first engage with a blog post, then a LinkedIn ad, attend a webinar, download a whitepaper, have multiple sales calls, and then finally convert. Which touchpoint gets credit?
- Multiple Stakeholders: In B2B, you're rarely selling to just one person. Different individuals within an account (e.g., end-user, IT manager, finance, CEO) interact with your marketing at different stages. Tracking and attributing influence across an entire buying committee is a significant challenge.
- Offline Touches: Don't forget the real world! Industry conferences, in-person meetings, direct mail, phone calls from sales reps – these also influence decisions, but are harder to track digitally.
- Dark Funnel: Sometimes, prospects interact with your brand in ways you can't easily track (e.g., word-of-mouth referrals, conversations in private communities, listening to a podcast where you're mentioned).
B. Common Attribution Models for B2B
Since no single model is perfect for every scenario, understanding the strengths and weaknesses of each is key.
- First-Touch Attribution: This model gives 100% credit to the very first marketing interaction a customer had with your brand.
- Pros: Great for understanding initial awareness and which channels are best at introducing new prospects to your brand. Simple to implement.
- Cons: Ignores all subsequent marketing efforts that nurtured the lead and influenced the final conversion. It can overemphasize top-of-funnel activities.
- Last-Touch Attribution: This model gives 100% credit to the final marketing interaction a customer had before converting.
- Pros: Simple and widely used. Clearly identifies the "closer" touchpoint.
- Cons: Ignores all the prior steps in the long B2B journey, which often do the heavy lifting of educating and convincing the buyer. It heavily favors bottom-of-funnel activities.
- Linear Attribution: This model distributes credit equally across all touchpoints in the customer journey. If there are five touchpoints, each gets 20% credit.
- Pros: Provides a more holistic view by acknowledging every interaction.
- Cons: Treats all touchpoints as equally important, which is rarely the case in complex B2B sales cycles.
- Time Decay Attribution: This model gives more credit to touchpoints closer to the conversion, with less credit given to earlier interactions. The idea is that recent interactions have more influence.
- Pros: Recognizes the increasing urgency and influence of later-stage touchpoints.
- Cons: Still subjective in how it weights the decay; might undervalue early-stage awareness.
- U-Shaped / Position-Based Attribution: This model assigns more credit to the first and last touchpoints (e.g., 40% each), with the remaining 20% distributed among the middle touches.
- Pros: Values both discovery (first touch) and conversion (last touch) while still giving some credit to nurturing efforts.
- Cons: The weighting is arbitrary and might not reflect actual influence.
- W-Shaped Attribution: Similar to U-shaped but adds significant weight to a key middle-of-funnel point, such as MQL creation or opportunity creation. For example, 30% to first touch, 30% to MQL creation, 30% to last touch, and 10% distributed.
- Pros: Especially useful in B2B where MQLs or PQLs (Product Qualified Leads) are key milestones.
- Cons: Still a pre-defined model, not necessarily reflecting the actual customer journey’s unique influence points.
- Custom / Algorithmic Attribution: This is the most sophisticated approach, leveraging AI and machine learning to assign credit based on the unique impact and interaction sequence of each touchpoint. These models analyze vast datasets to identify patterns and determine the true incremental value of each marketing interaction.
- Pros: Potentially the most accurate for complex B2B journeys, as it adapts to your specific data.
- Cons: Requires significant data volume, advanced analytical capabilities, and potentially specialized tools.
C. Implementing B2B Attribution Best Practices
Don't let the complexity scare you. Start somewhere and iterate.
- Map Your Customer Journey: Before you pick a model, understand the typical touchpoints your ideal customers experience. Visually map out their journey from awareness to conversion and beyond. This will highlight the key interactions that need tracking. Our insights on the importance of B2B customer journey mapping can provide a solid foundation for this.
- Integrate Your Data: This is non-negotiable for accurate attribution. Break down data silos between your CRM, marketing automation platforms, website analytics (Google Analytics), advertising platforms, and any product usage data. A unified data view is the holy grail. Without it, you’re trying to solve a puzzle with half the pieces missing.
- Choose the Right Model (or Combination): No single model is perfect for every scenario or every question. Use different models to gain different insights. For example, use First-Touch to optimize top-of-funnel campaigns and Last-Touch for conversion optimization, while using a multi-touch model for overall strategic resource allocation.
- Focus on Account-Based Attribution: In B2B, you're often selling to accounts, not just individuals. Track touchpoints across all stakeholders within a target account. An executive might view a case study, while an IT manager downloads a technical spec sheet, and an end-user tries a free product. All these contribute to the account's journey.
- Start Simple, Iterate: Don't get paralyzed by the complexity. Start with a basic multi-touch model like linear or time decay, ensure your data integration is solid, and then progressively move towards more sophisticated custom or algorithmic models as your capabilities mature.
For an even deeper dive into the practical framework for revenue attribution, especially within a B2B context, check out How to Measure B2B Marketing ROI: A Practical Framework for Revenue Attribution.
Leveraging AI & Automation for Smarter Metrics

This is where B2B growth marketing truly gets exciting. Manual data crunching is out; intelligent insights and automated actions are in. AI isn't just a buzzword; it's the engine that supercharges your metric analysis and optimization. If you're not thinking about how to integrate these tools, you're already behind.
A. AI for Predictive Analytics and PQL Identification
Imagine having a crystal ball for your B2B marketing efforts. That's what AI brings to the table, transforming raw data into actionable foresight.
- Predicting Churn Risk: This is huge. AI algorithms can analyze vast amounts of customer behavior and usage patterns, identifying accounts that are exhibiting signs of dissatisfaction or disengagement. Think about it: if a key user suddenly stops logging in, or usage of a core feature drops, AI can flag that account as "at risk" before they actually churn. This allows your customer success or sales teams to proactively intervene, offering support, personalized outreach, or re-engagement campaigns. This shifts your retention strategy from reactive to predictive, saving you serious revenue.
- Forecasting Future Revenue: Want more accurate revenue projections? AI models can analyze your current pipeline, historical sales cycle data, market trends, and even external economic indicators to provide far more precise forecasts. This helps finance and sales plan more effectively, and marketing can adjust spend to hit projected targets. For a deeper dive into this, check out our insights on AI-powered B2B sales forecasting.
- Automated Product Qualified Lead (PQL) Scoring: This is the gold standard for many modern B2B businesses, especially those embracing a product-led growth model. AI can automatically score leads based on their product engagement, specific feature usage, firmographics (company size, industry), and other signals. It flags the highest-intent users who have already experienced value from your product, making them "qualified" for a sales conversation. This drastically improves sales efficiency and conversion rates because your sales team is talking to prospects who are already warm and understand your solution.
B. Automation for Efficiency and Personalized Journeys
AI provides the intelligence, and automation provides the muscles. Together, they create a leaner, more effective growth marketing machine.
- Automated Reporting Dashboards: Say goodbye to endless hours spent manually pulling data into spreadsheets. Automation tools can pull data from various sources (CRM, website analytics, ad platforms) into real-time, customizable dashboards. This frees up your team from tedious data compilation, allowing them to focus on analysis and strategy. When your metrics update automatically, you get insights faster and can react quicker.
- Personalized Onboarding & Nurturing: This is where you can truly make your marketing feel 1:1. Automation allows you to trigger highly personalized in-app messages, email sequences, or content recommendations based on a user's behavior, progress through your product, or identified pain points. For instance, if a trial user hasn't engaged with a critical feature, an automated email can be triggered with a tutorial. This enhances activation and engagement, ensuring users get the most value at every step. This powerful streamlining is a core part of how AI-powered efficiency can automate your B2B workflows.
- Automated A/B Testing: Continuous experimentation is key to growth. Automation tools allow you to continuously test different elements of your marketing and product experience – variations in call-to-actions, messaging, landing page layouts, or even different feature flows. These automated tests run in the background, constantly gathering data and allowing you to optimize your funnels based on statistically significant results without manual intervention.
C. No-Code Solutions for Agile Metric Implementation
Speed and agility are crucial in today's fast-paced B2B landscape. No-code and low-code platforms are empowering marketing and growth teams to move faster than ever.
- Rapid Dashboard Creation: Gone are the days of needing a developer for every custom report. No-code analytics platforms allow marketing teams to quickly build and customize their own dashboards by dragging and dropping elements and connecting data sources. This means faster insights and less reliance on overburdened IT or dev teams.
- Quick Experimentation: Want to test a new lead capture form for a specific campaign? Need to spin up a quick landing page for a new offer? Or perhaps test a different in-app prompt? No-code tools allow you to build and deploy these elements rapidly, accelerating your experimentation cycles. This means you can run more tests, learn faster, and optimize your funnels with incredible agility. Our deep dive into why no-code is revolutionizing B2B websites highlights this very advantage.
- Connecting Disparate Data Sources: While complex integrations might still require custom code, many low-code/no-code integration platforms can help bridge gaps between different marketing, sales, and product systems. This allows for a more unified data view, which is essential for comprehensive metric analysis and accurate attribution. This ability to integrate and innovate rapidly is also a major benefit of no-code custom software for driving efficiency.
D. The Growthmak Advantage: Unifying Your Data for Actionable Insights
You see the power these technologies hold, right? We don't just talk about them; we implement them. At Growthmak, our core focus on AI enablement for B2B is designed precisely to help B2B companies like yours leverage these capabilities. We help you build the robust systems and strategies to harness your data, personalize user journeys, and identify growth opportunities that would be impossible with manual analysis. Our expertise in custom software development means we can build the integrations and AI models needed to transform your raw data into actionable growth strategies, ensuring you’re always ahead of the curve.
Setting Up Your B2B Marketing Metrics Framework
Knowing the metrics is one thing; consistently tracking, analyzing, and acting on them is another. Here’s a practical framework for building a robust metrics system that delivers real, measurable value. Think of this as your battle plan for data domination.
A. Define Your Goals First
Before you even think about tools or reports, you must define what success looks like. Metrics are meaningless without context.
- Start with Business Objectives: What are your company's overarching goals? Are you aiming for a 30% increase in Annual Recurring Revenue (ARR) next year? Are you trying to penetrate a new market? Reduce churn by 15%? Your marketing metrics must directly contribute to these top-level business objectives. If your metrics don't align with what the CEO cares about, you're missing the point.
- Set SMART Goals: This old chestnut is still gold. Make your goals Specific, Measurable, Achievable, Relevant, and Time-bound. Don't just say "increase leads"; say "increase Sales Qualified Leads (SQLs) by 20% in Q3 through targeted content marketing and LinkedIn Ads." This gives you a clear target and a timeline.
- Identify Your North Star Metric: This is the single most important metric that, if optimized, would have the biggest impact on your long-term success. For a B2B SaaS company, this could be Net Dollar Retention (NDR), Customer Lifetime Value (CLTV), or the number of Product Qualified Leads (PQLs). This "North Star" guides all your efforts and helps prevent teams from chasing conflicting goals.
B. Implement Your Measurement Stack
You can't track what you can't measure. Investing in the right tools is non-negotiable for a robust metrics framework.
- Website Analytics: Google Analytics 4 (GA4) is your best friend here. It’s essential for understanding website behavior, traffic sources, user engagement, and conversion paths. Make sure it's properly configured to track key B2B actions like form submissions, demo requests, and content downloads.
- CRM (Customer Relationship Management): Tools like HubSpot, Salesforce, or Zoho CRM are your source of truth for lead progression, sales activities, and closed-won deals. Your marketing efforts need to feed directly into your CRM so you can track leads from initial touch to customer.
- Marketing Automation Platform: Platforms such as HubSpot, Pardot, or Marketo are crucial for managing email campaigns, lead nurturing, and tracking MQLs. These tools often integrate with your CRM, providing a seamless flow of lead data.
- Product Analytics: For businesses with a product-led growth (PLG) component, tools like Mixpanel, Amplitude, or Pendo are vital. They provide deep insights into how users interact with your product after signing up – feature usage, activation rates, and PQL identification.
- Attribution Tools: For complex B2B journeys, dedicated attribution software (e.g., Bizible, Dreamdata) can provide granular multi-touch insights, showing you the true impact of each marketing touchpoint on revenue.
- Advertising Platforms: Google Ads, LinkedIn Ads, Facebook Ads – these platforms have their own robust analytics to track campaign performance (impressions, clicks, conversions) directly.
- Reporting & Visualization Tools: Tools like Google Data Studio (Looker Studio), Tableau, or Power BI allow you to pull data from disparate sources into centralized, customizable dashboards. This is where you bring all your metrics together for a unified view.
- Pro Tip: Don't just collect data; visualize it. Clear, intuitive dashboards empower your team to spot trends, identify issues, and make faster decisions. Need help building out your arsenal? Our guide to the growth marketing tool stack provides a comprehensive breakdown of essential tools.
C. Establish Reporting Cadence & Stakeholder Communication
Data is useless if it's not communicated effectively to the right people. Different stakeholders need different levels of detail and focus.
- Daily/Weekly Dashboards: For operational teams (your marketing managers, campaign specialists), a quick daily or weekly check-in on key performance indicators (KPIs) helps them track short-term performance and identify immediate issues. Think campaign performance, website traffic, and daily lead volume.
- Monthly Performance Reviews: This is a deeper dive. Schedule monthly meetings with marketing and sales leadership to review channel performance, lead quality, MQL-to-SQL conversion rates, and progress against monthly goals. This is where you discuss strategic adjustments.
- Quarterly Business Reviews (QBRs): These are high-level, strategic discussions with executive leadership. Focus on the big picture: Customer Acquisition Cost (CAC), Customer Lifetime Value (CLTV), overall revenue attribution, and the long-term ROI of your marketing investments. This demonstrates marketing’s impact on the company’s bottom line.
- Tailor Reports to Audiences: A sales leader needs to know about SQLs and opportunities; an executive cares about revenue and profitability. Don't send a one-size-fits-all report. Customize your dashboards and presentations to address the specific concerns and goals of each audience. For more insights on effective reporting, check out best practices in B2B marketing reporting.
D. Continuous Optimization and A/B Testing
Your metrics framework isn't a set-it-and-forget-it system. It's a living, breathing part of your growth strategy.
- Iterate Constantly: Review your metrics regularly and be prepared to refine your strategies based on what the data tells you. What worked last quarter might not work this quarter. The market evolves, your product changes, and your customers' needs shift. Your strategy, and the metrics you track, must evolve with it.
- Build a Testing Culture: Encourage your team to continuously test hypotheses about what drives better metrics. Small, consistent A/B tests on landing pages, ad creatives, email subject lines, or even pricing models can lead to massive improvements over time. This iterative, experimental approach is at the heart of genuine growth.
- Learn from Failures: Not every experiment will succeed. That's okay! Analyze why something didn't work. Was it the targeting? The messaging? The offer? Use these "failures" as learning opportunities to refine your approach and make your next experiment even smarter. This commitment to data-driven improvement is precisely what sets top-tier data-driven B2B marketing strategies apart.
Common Pitfalls to Avoid in B2B Marketing Metrics
Even with the best intentions, it's easy to stumble. Avoiding these common traps will save you time, money, and a lot of headaches. Learn from the mistakes others have made, so you don't have to repeat them.
A. Vanity Metrics Obsession
- The Trap: This is perhaps the most common pitfall. It's focusing on numbers that look good but don't actually translate to business outcomes. Think about thousands of website visitors without any conversions, or tons of social media likes without any engagement that leads to pipeline. These metrics inflate your ego, not your revenue. You might even hear marketers boast about "reach" or "impressions" when those numbers aren't tied to any tangible business result.
- The Solution: Always, and I mean always, link your metrics back to revenue, pipeline, or customer retention. Ask yourself: "So what? What does this metric actually tell me about the health or growth of my business?" If you can't draw a clear line from a metric to a business objective, it's probably a vanity metric that needs to be de-prioritized or even ignored. Focus on actionable metrics that drive real decisions.
B. Data Silos and Disconnected Systems
- The Trap: This is a classic B2B nightmare. You've got marketing data in one system, sales data in your CRM, product usage data in a separate analytics platform, and maybe customer support logs in yet another. These disconnected systems create "data silos" – islands of information that prevent you from seeing the full, end-to-end customer journey. Without a unified view, accurate B2B marketing attribution becomes impossible, and your teams operate in the dark, leading to wasted spend and missed opportunities.
- The Solution: Invest in integrations (or custom software development) to connect your platforms. This means ensuring your CRM talks to your marketing automation platform, which talks to your website analytics, and ideally, to your product analytics tools. A unified data source is paramount for accurate attribution, comprehensive analysis, and building a truly data-driven B2B growth strategy.
C. Ignoring Customer Lifetime Value (CLTV)
- The Trap: Many B2B businesses get so caught up in the thrill of acquiring new customers that they neglect the massive value of their existing ones. They might focus heavily on lowering Customer Acquisition Cost (CAC), but if those acquired customers churn quickly, you're constantly refilling a leaky bucket. This short-sighted approach severely limits long-term profitability.
- The Solution: Make Customer Lifetime Value (CLTV) and Net Dollar Retention (NDR) core KPIs for your marketing team. Remember, it's often significantly more cost-effective to retain and expand existing customers than to acquire new ones. A high NDR means your existing customer base is a self-sustaining growth engine. By understanding CLTV, you know how much you can afford to spend on CAC and still be profitable.
D. Lack of Sales and Marketing Alignment
- The Trap: This is a tale as old as time in B2B. Marketing generates leads that sales deems unqualified or low-quality, leading to frustration and wasted effort. Or, sales doesn't follow up on high-quality leads quickly enough, allowing them to go cold. This "blame game" hinders pipeline progression and stifles growth.
- The Solution: This is fundamental for B2B growth marketing. Define your Marketing Qualified Leads (MQLs) and Sales Qualified Leads (SQLs) jointly with your sales team. This isn't a marketing decision alone. Hold regular, structured cross-functional meetings where both teams review lead quality, discuss handoff processes, and align on goals. Use shared dashboards and a common language around lead progression and conversion. When sales and marketing are truly aligned, your conversion rates skyrocket.
E. Over-Complicating Attribution
- The Trap: Getting bogged down in overly complex attribution models without clear, actionable insights. While sophisticated models are powerful, trying to implement a complex algorithmic model when your basic data integration is still fragmented is like trying to build a skyscraper on a swamp. You'll spend more time arguing about credit than actually growing.
- The Solution: Start simple (e.g., a linear or U-shaped model) and ensure your foundational data is clean and integrated. As your data maturity grows, you can progressively evolve towards more sophisticated marketing attribution models or even custom AI-driven solutions. The goal is insights that help you make better decisions, not perfect mathematical credit that is impossible to achieve in a truly complex B2B journey. Focus on continuous improvement rather than immediate perfection.
F. Stagnant Reporting
- The Trap: Creating a set of reports once and never updating them, or failing to adapt your metrics as business goals change, new campaigns launch, or market conditions shift. A report that was useful six months ago might be completely irrelevant today if your strategy has evolved. This leads to outdated insights and misguided decisions.
- The Solution: Treat your reporting framework as a living document. Regularly review it, solicit feedback from all stakeholders, and iterate to ensure relevance. As your B2B growth strategy evolves, so too should the metrics you track and the way you report on them. Be agile, adapt quickly, and ensure your metrics are always aligned with your current business priorities.
Conclusion: Turn Your Data into Your Growth Superpower
We've covered a lot of ground, haven't we? From the foundational metrics of acquisition and lead generation to the nuances of sales pipeline efficiency, customer lifetime value, and the transformative power of AI in attribution. The message is clear: in today's B2B landscape, your growth marketing isn't just about creative campaigns or compelling content. It's fundamentally about data.
When you master your B2B growth marketing metrics, you stop guessing and start knowing. You can pinpoint exactly what strategies are delivering ROI, optimize your spend with surgical precision, and articulate marketing’s direct impact on the bottom line. This empowers you to make smarter decisions, allocate resources more effectively, and build a truly scalable and sustainable business.
Don't let your valuable marketing efforts go unmeasured. Embrace the power of data, leverage intelligent tools, and transform your metrics into your unfair competitive advantage. The future of B2B growth isn't just product-led or sales-led; it's data-led.
Stop guessing, start growing. Let's make your B2B metrics tell a story of unparalleled success.
Related Blogs

.jpg)
Get Started with Growthmak Today!
Unlock your marketing potential with our expert team.