
B2B Marketing Analytics: Key Metrics to Track


Let’s cut through the fluff: if you’re not tracking the right marketing metrics in B2B, you’re not running a growth engine, you’re running a guessing game.
For decades, marketing was seen as a creative field, something driven by gut instincts, flashy campaigns, and a healthy dose of “spray and pray.” But those days are gone. In today’s hyper-competitive digital landscape, marketing without analytics is like driving blindfolded; you might move fast, but you’ll eventually crash.
Here’s the brutal truth: many B2B marketers still obsess over vanity metrics. They celebrate likes, impressions, or page views while missing the data points that actually fuel the pipeline and revenue. The result? CMOs struggle to prove ROI, sales complain about “bad leads,” and budgets get slashed when growth stalls.
But what if you could pinpoint exactly which campaigns, touchpoints, and channels are driving qualified opportunities? What if you could forecast pipeline growth with precision, align with sales seamlessly, and justify every dollar you spend? That’s the power of B2B marketing analytics done right.
In this guide, we’ll dive into the key metrics every B2B marketer must track, from awareness to retention, and show you how to transform raw numbers into strategic insights that accelerate growth.
Why B2B Marketing Analytics is Non-Negotiable?
B2B buying cycles are long, complex, and rarely linear. Prospects may interact with your brand across 10, 15, or even 20 touchpoints before ever talking to sales. Without a robust analytics framework, it’s impossible to know:
- Which campaigns are generating qualified leads?
- Where prospects drop off in the funnel.
- How marketing contributes to the pipeline and revenue.
According to Gartner, CMOs who align marketing analytics with revenue goals are 3x more likely to exceed their growth targets. Translation? Data-driven marketers win.
But analytics isn't just about reporting. It’s about insight-driven decisions. It’s the difference between:
- Saying “Our webinar had 500 attendees” vs. “Our webinar drove 12 new opportunities worth $1.2M in pipeline.”
One is noise. The other is growth.
The Role of KPIs in Marketing Analytics
Have you ever asked yourself how you know if your marketing is working? This is where Key Performance Indicators (KPIs) can help. KPIs are measurable values that indicate progress toward marketing objectives. Monitoring KPIs across all stages of the funnel: awareness, consideration, and decision, allows you to identify your customers’ areas of friction and adjust your funnel accordingly.
Moving on to marketing analytics. It is all about data collection, analysis, and interpretation, and being able to understand how well your marketing works. By utilizing KPIs in your marketing analytics, you can base decisions on actual consumer actions and market behavior. It’s the best of data-based decision making, providing a basis for planning rather than relying on gut instinct.
Creativity and data are balanced in marketing. Tracking KPIs allows you to not only duplicate what works but also to analyze why certain campaigns outperform others. The right metrics get your marketing where it needs to be and in alignment with your business goals, which increases ROI.
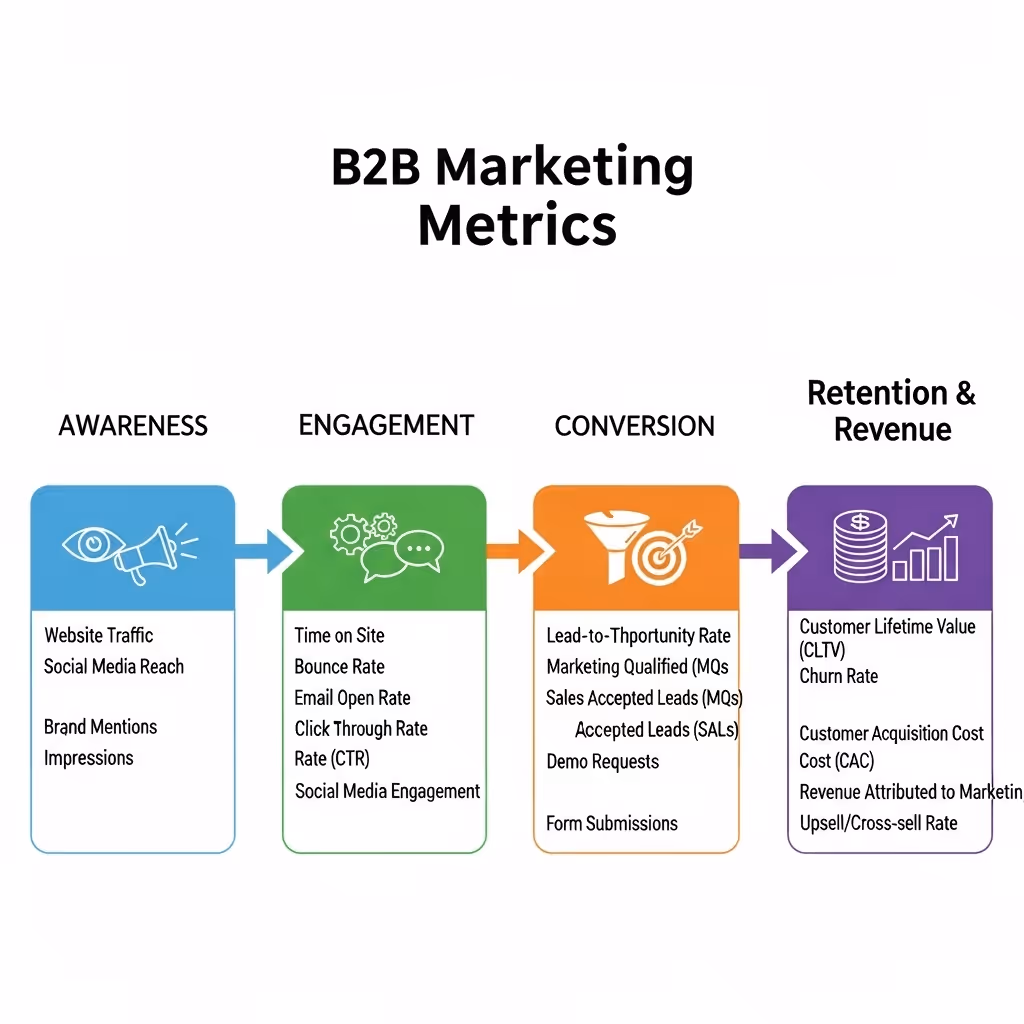
The Four Buckets of B2B Metrics
To keep things simple, let’s break marketing analytics into four big categories:
- Awareness Metrics → Are we visible to the right people?
- Engagement Metrics → Are prospects meaningfully interacting with us?
- Conversion Metrics → Are we turning interest into pipeline and revenue?
- Retention & Revenue Metrics → Are we keeping customers, growing them, and driving long-term value?
Get these four buckets right, and you’ll have a complete 360° view of your marketing’s impact.
Awareness Metrics: Measuring Visibility
32.9% of internet users aged 16+ discover new brands, products, and services via search engines. The first question every B2B marketer must answer: Do the right people even know we exist?
Key Awareness Metrics
- Website Traffic: Total sessions, unique visitors, and bounce rate. High traffic means visibility, but pair it with quality checks (time on site, conversions).
- Impressions & Reach: Ads, social media, PR mentions. Are you actually getting in front of your target audience?
- Share of Voice: How does your visibility compare to competitors in SEO and social channels?
- Keyword Rankings: Are you ranking for the terms your ICP (Ideal Customer Profile) is searching?
Why It Matters
Without awareness, nothing else matters. But here’s the catch: not all traffic is good traffic. A million website visits don’t matter if they’re not from decision-makers in your target accounts.
Pro Tip: Don’t chase vanity traffic. Focus on qualified traffic, the prospects most likely to convert. Use tools like Semrush or Ahrefs to track ICP-driven keyword rankings instead of broad, irrelevant ones.
Engagement Metrics: Beyond Surface-Level Clicks

So people know you exist. Great. But are they paying attention? Are they engaging deeply with your brand or just bouncing after one click?
Key Engagement Metrics
- Time on Page & Pages per Session: Signals if content is resonating or just skimmed.
- Content Performance and Engagement: Downloads, webinar signups, video views, and blog shares can increase your B2B content engagement.
- Email Engagement: Open rates, click-through rates (CTR), and reply rates (far more valuable than opens). Use the best email marketing strategies for improved lead generation.
- Social Engagement: LinkedIn comments, reposts, meaningful discussions (not just likes).
- Event Participation: Attendees at webinars, conferences, or roundtables.
Why It Matters
Engagement is a leading indicator of intent. The more time prospects spend consuming your content and interacting with your brand, the more likely they are to enter your pipeline.
Pro Tip: Track depth of engagement, not just volume. For example, a single prospect who reads 5 case studies is more valuable than 100 people who like a generic social post.
Conversion Metrics: From Interest to Revenue
Here’s where the rubber meets the road. Awareness and engagement are great, but if they don’t convert into opportunities and revenue, they’re just noise.
Key Conversion Metrics
- MQL to SQL Conversion Rate: Are your marketing leads actually high-quality? If sales rejects most leads, there’s a targeting or nurturing problem.
- Lead-to-Opportunity Rate: Measures how effectively your nurturing turns interest into real deals.
- Pipeline Contribution from Marketing: % of total pipeline sourced or influenced by marketing.
- Cost per Lead (CPL) & Cost per Opportunity (CPO): Efficiency of acquisition campaigns.
- Customer Acquisition Cost (CAC): Total marketing + sales costs divided by new customers acquired.
Why It Matters
Conversion metrics reveal the true ROI of your marketing. They’re the bridge between activity and revenue.
Pro Tip: Never look at CAC in isolation. Pair it with Customer Lifetime Value (CLV). A CAC:CLV ratio of 1:3 is generally healthy in B2B SaaS, meaning for every $1 spent acquiring a customer, you make $3 back.
Retention & Revenue Metrics: The Growth Multiplier
Most marketers stop at acquisition. Big mistake. In B2B, the real money is made in retention, renewals, and expansion.
Key Retention Metrics
- Customer Lifetime Value (CLV): Total expected revenue from a customer across their relationship.
- Churn Rate: % of customers (or revenue) lost in a given period.
- Net Promoter Score (NPS): Customer loyalty and likelihood to refer.
- Expansion Revenue: Upsells and cross-sells from existing accounts.
- Renewal Rates: Particularly critical for SaaS or recurring models.
Why It Matters
Acquiring a new customer costs 5–25x more than retaining an existing one. Long-term profitability depends on keeping customers happy, engaged, and expanding.
Pro Tip: Treat marketing as a post-sale partner, not just a lead engine. Customer communities, education campaigns, and loyalty programs are powerful retention plays.
Leveraging AI & Predictive Analytics
Here’s the next frontier: AI isn’t just a buzzword; it’s transforming how B2B companies use analytics.
- Predictive Lead Scoring: AI analyzes past conversion patterns to rank leads by likelihood to buy.
- Churn Prediction: Machine learning models can flag accounts at risk before they cancel.
- Sentiment Analysis: AI scans support tickets, reviews, and chat logs to detect customer frustration early.
- Attribution Insights: Advanced models reveal which touchpoints (ads, blogs, webinars) truly drive conversions.
Pro Tip: Stop reporting only what happened. Use AI-powered analytics to predict what’s next and act before opportunities (or risks) slip away.
Building Your B2B Marketing Dashboard
Tracking metrics is one thing. Making them actionable is another. Enter dashboards.
Best Practices
- Integrate Systems: Connect CRM (Salesforce, HubSpot) with analytics (GA4, Looker, Power BI). Avoid data silos.
- Keep It Simple: C-suite leaders want 5 KPIs, not 50. Focus on pipeline, CAC, CLV, churn, and revenue influence.
- Customize by Role: Marketing needs detailed campaign data. Executives want outcomes. Build different views.
Pro Tip: Anchor your dashboards around North Star Metrics, the single most important measure of marketing’s impact. For many B2B orgs, that’s Marketing-Sourced Pipeline.
Additional Awareness & Engagement Metrics
Leads In
48% of B2B marketers report that driving enough leads is a challenge, and 24% experience difficulties converting leads into revenue. While you may already track MQLs, it’s worth also looking at total leads in. This measures raw lead volume per campaign. It’s especially powerful when compared across channels; if one ad is driving fewer but more qualified leads, it may actually be more cost-effective.
Formula:
Cost per Lead (CPL) = Total Marketing Spend ÷ Total Number of New Leads
Pro Tip: Don’t just measure “leads in.” Combine it with conversion to pipeline to avoid flooding sales with low-quality leads. Contact an expert lead generation agency for better results.
Cost per Click (CPC) & Click-Through Rate (CTR)
These tactical ad metrics show whether your paid campaigns are resonating.
- CPC tells you how efficiently you’re buying traffic.
- CTR reveals whether your messaging grabs attention enough to earn a click.
While they don’t prove revenue impact directly, CPC and CTR are critical for diagnosing ad performance early.
Pro Tip: High CTR but low conversion? That’s a messaging vs. landing page mismatch.
Dark Social Metrics
A huge chunk of B2B engagement happens off the grid, shared via WhatsApp, Slack, email, or copy-paste links. Attribution software often misses this.
Ways to measure:
- Track shares with sticky share buttons.
- Use shortened URLs with UTMs.
- Add “How did you hear about us?” fields on demo forms.
Pro Tip: Dark social often drives high-intent leads. Don’t underestimate it just because it’s hard to measure.Additional Conversion Metrics
Sales Qualified Opportunities (SQOs)
MQLs are marketing’s contribution, but SQOs are where sales validates the lead as a true opportunity. This metric is critical because it’s the bridge between marketing activity and real pipeline.
Formula:
Cost per SQO = Total Marketing Spend ÷ Number of New Opportunities
Pro Tip: Always look at Cost per SQO alongside Closed-Won Revenue. A high number of SQOs is meaningless if they don’t convert.
Closed-Won Deals
Ultimately, this is what CEOs and boards care about: how many opportunities marketing influenced or sourced that actually became paying customers.
Tracking Closed-Won by campaign tells you which efforts generate real revenue vs. noise.
Pro Tip: Pair Closed-Won with Average Deal Size for better forecasting.
Average Sales Cycle
This measures how long it takes from first touch to closing a deal.
Formula:
Average Sales Cycle = Total Days from First Touch to Close ÷ Number of Deals Won
Why it matters: If certain campaigns shorten the sales cycle, they’re disproportionately valuable, even if they don’t bring the biggest volume.
Lead-to-Close Conversion Rate (CVR)
This tracks the % of leads that ultimately become customers.
Formula:
CVR = Number of Sales ÷ Number of Leads Generated
It’s a key way to tie marketing activities back to revenue efficiency, not just volume.
Additional Revenue & Retention Metrics
Monthly Recurring Revenue (MRR)
Especially relevant for SaaS, MRR measures the predictability of your revenue stream.
Formula:
MRR = Monthly Recurring Revenue Generated by That Month’s Customers
Pro Tip: Track MRR growth alongside CAC to ensure your acquisition is sustainable.
Average Deal Size
This metric reveals the average revenue per closed deal. It’s vital for planning forecasts and optimizing campaigns for higher-value accounts.
Formula:
Average Deal Size = Total Revenue in Period ÷ Number of Closed-Won Deals
Pro Tip: For ABM campaigns, use average deal size to measure whether your targeting is paying off in larger contracts, not just more deals.
Examples in Action
Let’s say you run a LinkedIn campaign targeting IT decision-makers.
- Awareness: CTR 3.5%, CPC $8 → strong engagement.
- Engagement: Webinar sign-ups 120, Avg. time-on-page 4 minutes.
- Conversion: 20 MQLs → 12 SQOs → 3 Closed-Won worth $180k in ARR.
- Retention: NPS 45, renewal likelihood high.
By layering metrics across the funnel, you now see the full ROI story: this single LinkedIn campaign didn’t just drive clicks, it delivered $180k in revenue and high-quality accounts.
Turning Raw B2B Sales Metrics Into Actionable Insights
Delivering clients raw sales data is only part of the job. But, as indicated, the value is in transforming that data into insights. Counting deals or other relevant sales metrics alone will not allow your clients to make informed decisions unless you are able to connect the dots.
Sales and marketing departments depend on your analysis of the data, the trends you find ,and the concise recommendations you provide to make a good marketing strategy.
You require a framework to improve your sales KPI’s and support your clients in reaching their goals.
Tips for Turning Sales Metrics Into Insights:
- Establish Clear Goals & KPIs: Begin with clear objectives to assess performance and sales metrics that are of greatest importance to clients. They also serve as a measure of success and help you and your clients remain on the same page.
- Define Important Metrics: In order to highlight data that makes an impact, concentrate on sales KPIs such as the number of deals or customers. Choosing the appropriate metrics avoids cluttered reports and helps focus on the most valuable insights.
- Identify Trends: Use the data to find trends in the sales over time to see where the trends can be improved . Trend analysis identifies patterns of ongoing problems or successes and allows for real-time course corrections.
- Benchmark Against Peers: Use performance metrics to benchmark your client against peers to provide context and identify opportunities. Marketing benchmarking provides clients with a clear view of their positioning and competitive advantages.
- Connect the Dots With Other Platforms: Bring in metrics from 80+ platforms to get a holistic view of sales and marketing performance. Cross-platform analysis helps clients to understand the ways in which all of the areas in which they are working interact to improve outcomes.
- Translate Analysis into Strategy: Analysis should be translated into recommendations that support your client’s goals and vision. Clients are enabled to make decisions that affect their bottom line based on data-driven processes.
Partner with GrowthMak.com for a tailored consultation and gain data-driven insights to accelerate growth, optimize strategies, and unlock your business’s full potential.
Conclusion
Let’s be clear: tracking “everything” isn’t the goal. Tracking what matters is.
By focusing on the right awareness, engagement, conversion, and retention metrics, you can prove marketing’s ROI, align seamlessly with sales, and build predictable, scalable growth.
In today’s B2B world, analytics isn’t just about dashboards; it’s about direction. Without it, you’re navigating in the dark. With it, you’ve got a clear roadmap to sustainable growth.
Ready to stop guessing and start scaling? Let’s build your analytics engine. Contact GrowthMak.com today for a tailored B2B marketing analytics strategy.
Related Blogs


Get Started with Growthmak Today!
Unlock your marketing potential with our expert team.